Department of City Planning
Section 21 · Pages 131–137 · 4 tables · includes narrative
Key changes
- Budget increases 5.4% ($288K), led by $174K more in Personnel-Employee Benefits
- Reduces by 3 positions (56 → 53 FTE)
On this page
Page 131
Department of City Planning
 Department of City Planning
Page 132
Figure
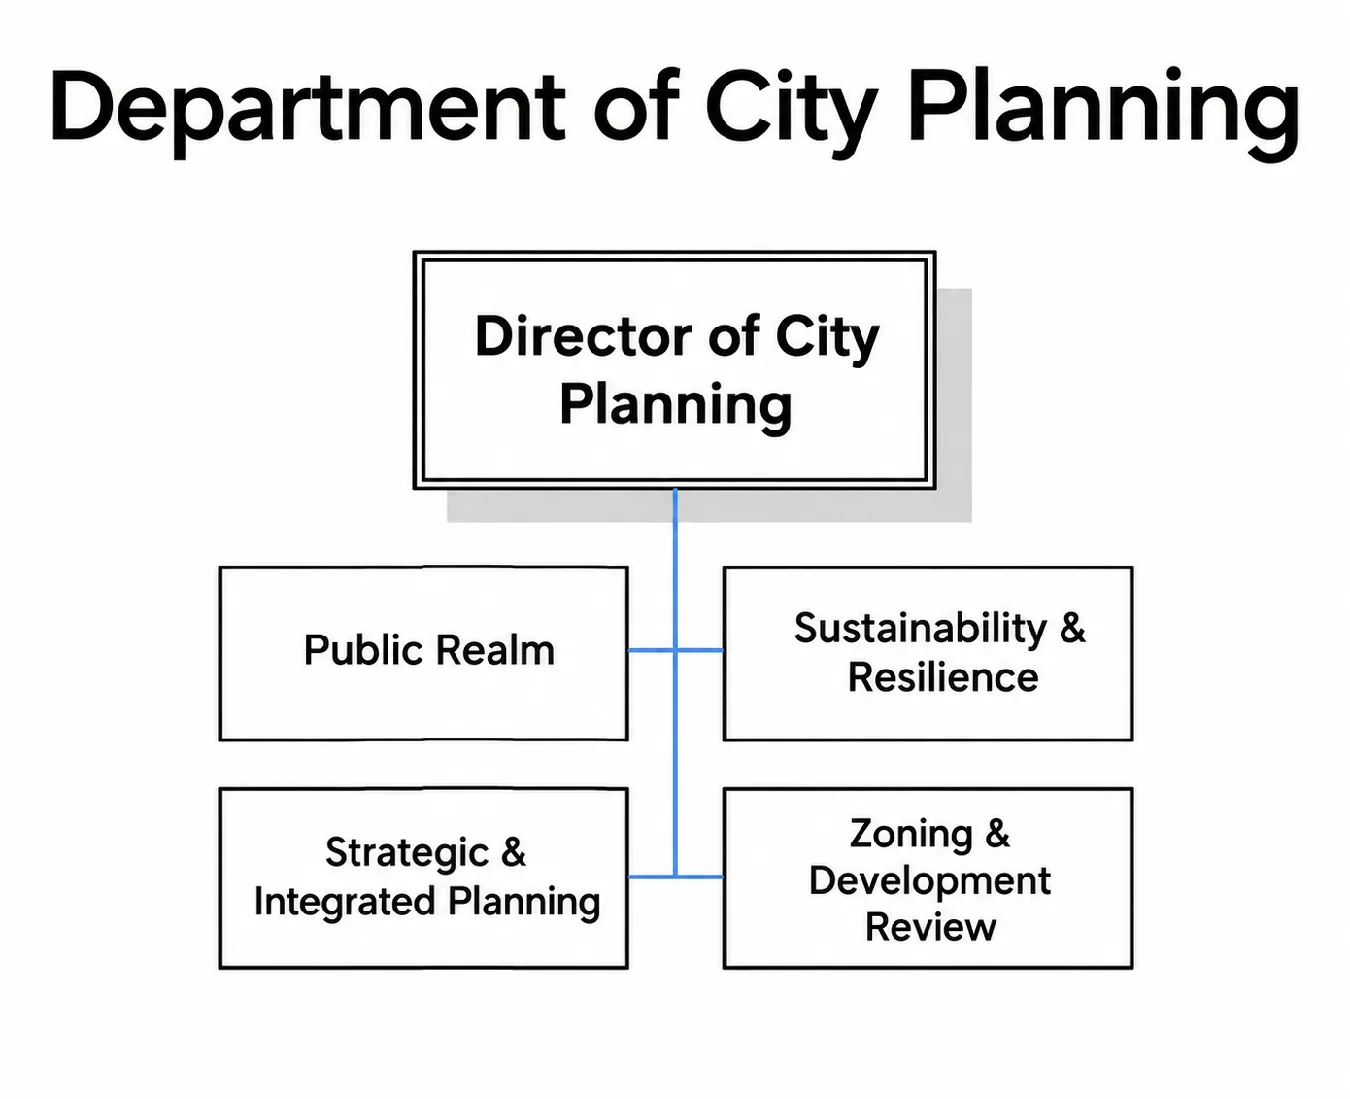
Page 133
Mission
The Department of City Planning works with partners to plan and deliver a vision for the City’s future grounded in a Just Transition.
Strategic Objectives
- Grow DCP into a center of gravity that enables City government and its partners to take big, coordinated actions to advance a Just Transition for Pittsburgh.
- Create a center of excellence in terms of efficiency and customer service.
- Create a shared sense of pride and responsibility among DCP staff. Departmental/Bureau Overview Public Realm – The Public Realm Division proactively engages with and supports communities who face the steepest challenges in accessing civic design opportunities, historic preservation resources, and public art initiatives. Strategic & Integrated Planning – Strategic Planning is responsible for supporting residents – particularly historically marginalized communities – in understanding the tools at their disposal to play meaningful roles in the planning and implementation of holistic policies, programs, and partnerships. Integrated Planning manages data, develops plans, and informs policies related to food access, vacant land, housing, mobility, and economic opportunity. Sustainability & Resilience – Sustainability & Resilience advances Pittsburgh’s vision for environmental protection, climate change mitigation, adaption, and strategies to address the impacts of climate hazards on vulnerable residents and communities. Zoning & Development Review – Zoning & Development Review is responsible for facilitating an understanding of the land use and regulatory needs of communities that have been historically harmed by past planning actions. 2026 Accomplishments
- PGH2050 – Pittsburgh's Comprehensive Plan
- Conducted two rounds of public engagements on draft content (April & September), while also coordinating with other city departments & Authorities that will be part of the implementation of key actions in the plan.
- Hit the target of 10% resident engagement for the Plan process
- Created a draft Comprehensive Plan which is in Public Review
- Created a package of stewardship legislation, which expanded resident’s ability to more easily steward City-owned vacant properties through revisions to the Adopt-A-Lot Program, work on creating community- stewarded open spaces through the Greenways Program, and garden in City parks and greenways through the City Farms Garden Program.
- Three new Percent for Art projects completed (totaling $330,000), which include the University Line, the Hill District, and Beechview.
- Improved the Development review process by updating Title 11 (Historic Preservation), Title 13 (Stormwater regulations), updating the RCO program, and completing Historic District Design Guidelines for Manchester and the Mexican War Streets.
- Obtained LEED for Cities GOLD certification
- Updated a Flood & Landslide Prone Overlap Zoning District Map and developed a policy framework to guide decision-making about buyouts, and infrastructure improvements.
- On pace to work on approximately 10,000 applications this year, ranging from Property Certification to major developments and master plans, and shortened permit review times.
- Permits issued is up from last year. Jan-Oct 2025 = 1,097; Jan-Oct 2026 = 1,537
- Median days to issuance for all permits issued in these years (regardless of start date) is down. 2025 = 84 days; 2026 = 81 days 133
Page 134
- Permits created & issued in the same year is up & review times are down. Jan-Oct 2025 = 888 permits, averaging 93 days to issuance; Jan-Oct 2026 = 911 permits, averaging 57 days to issuance
- Collaborated with PLI, DOMI, and the Mayor’s Office on the Mayor’s Executive Order regarding permitting reform: launching the EZ Permit - a one business day turnaround on permit issuance for a number of smaller scale project scopes, including the installation of residential HVAC units – and revamping the pre- application process to provide quicker meeting scheduling, more prescriptive guidance and roadmap of the review process, and direct integration into permit review.
- Advanced six significant zoning text and map amendments through the Planning Commission process, including incentives for affordable housing; regulations for retail: tobacco, inhalants, and cannabinoids; updates to uses in the Urban Center-Employment zoning district; and small, targeted reforms called for in the first phase of the Mayor's Executive Order on permitting reform.
Page 135
Position Summary
personnel
Page 4, Table 0 (p. 135 in full PDF)
Lists authorized positions with FTE counts and pay grades.
| Title | 2026 FTE | Rate/ Grade | Hours/ Months | 2026 Budget | 2027 FTE | Rate/ Grade | Hours/ Months | 2027 Budget |
|---|---|---|---|---|---|---|---|---|
| Planning Administration | ||||||||
| Planning Director | 1 | 35G | 12 | 132,995 | 1 | 35G | 12 | 136,989 |
| Deputy Director | 1 | 33G | 12 | 120,827 | 1 | 33G | 12 | 124,446 |
| Assistant Director - Public Art & Civic Design | 1 | 32G | 12 | 114,046 | 1 | 32G | 12 | 117,458 |
| Assistant Director - Strategic Planning | 1 | 32G | 12 | 114,046 | — | 32G | 12 | — |
| Assistant Director - Sustainability & Resilience | 1 | 32G | 12 | 114,046 | 1 | 32G | 12 | 117,458 |
| Zoning Administrator | 1 | 32G | 12 | 114,046 | 1 | 32G | 12 | 117,458 |
| Senior Planning Manager | 1 | 29G | 12 | 101,525 | 1 | 29G | 12 | 104,562 |
| Planning Manager | 5 | 25G | 12 | 430,040 | 4 | 25G | 12 | 354,348 |
| Department Business Administrator | 1 | 24G | 12 | 82,742 | 1 | 24G | 12 | 85,218 |
| Principal Planner | 7 | 76,476 | 12 | 535,332 | 8 | 78,771 | 12 | 630,168 |
| Special Projects Operations Manager | 1 | 22G | 12 | 76,294 | 1 | 22G | 12 | 78,582 |
| Policy and Planning Analyst | 1 | 22G | 12 | 76,294 | 1 | 22G | 12 | 78,582 |
| Senior Planner | 14 | 73,545 | 12 | 1,029,630 | 15 | 75,751 | 12 | 1,136,265 |
| Planner | 14 | 65,518 | 12 | 917,252 | 12 | 67,483 | 12 | 809,796 |
| Digital Engagement Coordinator | 1 | 18G | 12 | 64,542 | — | 18G | 12 | — |
| Engagement Specialist | 2 | 16G | 12 | 118,602 | 2 | 16G | 12 | 122,179 |
| Administrator 2 | 2 | 56,761 | 12 | 113,522 | 2 | 58,464 | 12 | 116,928 |
| Administrative Specialist | 1 | 45,593 | 12 | 45,593 | 1 | 46,961 | 12 | 46,961 |
| Total Full-Time Permanent Positions | 56 | 4,301,374 | 53 | 4,177,398 |
personnel
Page 4, Table 1 (p. 135 in full PDF)
Lists authorized positions with FTE counts and pay grades.
| Title | 2026 FTE | Rate/ Grade | Hours/ Months | 2026 Budget | 2027 FTE | Rate/ Grade | Hours/ Months | 2027 Budget |
|---|---|---|---|---|---|---|---|---|
| Temporary, Part-Time, and Seasonal Allowances | ||||||||
| Zoning Board Member | — | 36.43 | 1,560 | 56,838 | — | 36.43 | 1,560 | 56,838 |
| Planning Intern | — | 9.00-11.00 | 5,202 | 5,358 | — | 9.00-11.00 | 5,202 | 5,358 |
| — | 62,196 | — | 62,196 | |||||
| Total Full-Time Permanent Positions | 56 | 4,301,374 | 53 | 4,177,398 | ||||
| Temporary, Part-Time, and Seasonal Allowances | — | 62,196 | — | 62,196 | ||||
| Vacancy Allowance | — | (257,374) | — | (44,304) | ||||
| Total Full-Time Positions and Net Salaries | 56 | 4,106,196 | 53 | 4,195,290 |
Page 136
Subclass Detail
financial_summary
Page 5, Table 0 (p. 136 in full PDF)
Compares actual, budgeted, and proposed spending across fiscal years.
| 2025 Actual | 2026 Budget | 2027 Budget | Increase/ (Decrease) | % Change | |
|---|---|---|---|---|---|
| Expenditures | |||||
| 51 - PERSONNEL-SALARIES & WAGES | 3,867,650 | 4,118,420 | 4,218,740 | 100,320 | 2.4% |
| 51101 - Regular | 3,802,030 | 4,050,779 | 4,133,099 | 82,321 | |
| 51103 - Part-Time | 45,521 | 62,196 | 62,196 | — | |
| 51201 - Longevity | — | 500 | 3,500 | 3,000 | |
| 51207 - Leave Buyback | 19,445 | — | 15,000 | 15,000 | |
| 51401 - Premium Pay | 654 | 4,945 | 4,945 | — | |
| 52 - PERSONNEL-EMPLOYEE BENEFITS | 927,135 | 1,102,530 | 1,276,977 | 174,447 | 15.8% |
| 52101 - Health Insurance | 486,244 | 595,909 | 741,667 | 145,757 | |
| 52111 - Other Insurance/Benefits | 78,407 | 78,852 | 80,940 | 2,088 | |
| 52201 - Social Security | 283,445 | 324,996 | 335,047 | 10,051 | |
| 52301 - Medical-Workers' Compensation | — | 2,662 | 2,662 | — | |
| 52601 - Personal Leave Buyback | 79,039 | 74,740 | 91,290 | 16,550 | |
| 52602 - Tuition Reimbursement | — | 25,370 | 25,370 | — | |
| 53 - PROFESSIONAL & TECHNICAL SERVICES | 3,650,291 | 70,150 | 83,150 | 13,000 | 18.5% |
| 53101 - Administrative Fees | 14,440 | 10,750 | 16,750 | 6,000 | |
| 53105 - Recording/Filing Fees | 14,375 | 20,000 | 20,000 | — | |
| 53301 - Workforce Training | 20,168 | 23,500 | 23,500 | — | |
| 53509 - Computer Maintenance | 24,120 | 900 | 900 | — | |
| 53901 - Professional Services | 3,577,189 | 15,000 | 22,000 | 7,000 | |
| 55 - OTHER SERVICES | 5,659 | 11,744 | 11,744 | — | —% |
| 55101 - Insurance Premiums | 4,545 | 4,600 | 4,600 | — | |
| 55301 - Employment Related | 245 | 750 | 750 | — | |
| 55305 - Promotional | — | 3,144 | 3,144 | — | |
| 55309 - Regulatory | 869 | 2,250 | 2,250 | — | |
| 55501 - Printing & Binding | — | 1,000 | 1,000 | — | |
| 56 - SUPPLIES | 23,574 | 27,050 | 27,050 | — | —% |
| 56101 - Office Supplies | 10,583 | 15,000 | 15,000 | — | |
| 56151 - Operational Supplies | 12,991 | 12,050 | 12,050 | — | |
| Expenditures Total | 8,474,309 | 5,329,894 | 5,617,661 | 287,767 | 5.4% |
Page 137
Five Year Forecast
DEPARTMENT OF CITY PLANNING 2027 Expenditures by Subclass
55 - OTHER SERVICES 56 - SUPPLIES 53 - PROF. & TECHNICAL SERVICES 52 - PERSONNEL-EMPLOYEE BENEFITS
51 - PERSONNEL-SALARIES & WAGES
forecast
Page 6, Table 0 (p. 137 in full PDF)
Projects budget figures across multiple future years.
| 2027 | 2028 | 2029 | 2030 | 2031 | |
|---|---|---|---|---|---|
| Expenditures | |||||
| 51 - PERSONNEL-SALARIES & WAGES | 4,218,740 | 4,342,128 | 4,385,915 | 4,430,675 | 4,475,114 |
| 52 - PERSONNEL-EMPLOYEE BENEFITS | 1,276,977 | 1,316,210 | 1,348,671 | 1,382,257 | 1,391,653 |
| 53 - PROFESSIONAL & TECHNICAL | 83,150 | 76,150 | 76,150 | 76,150 | 76,150 |
| 55 - OTHER SERVICES | 11,744 | 11,844 | 11,844 | 11,844 | 11,844 |
| 56 - SUPPLIES | 27,050 | 27,050 | 27,050 | 27,050 | 27,050 |
| Total | 5,617,661 | 5,773,382 | 5,849,630 | 5,927,976 | 5,981,811 |
| % Change from Prior Year | 5.4% | 2.8% | 1.3% | 1.3% | 0.9% |